Beschrijving:
De twee soorten vorticiteitsadvectie - positieve (PVA) en negatieve (NVA) -
zijn gemakkelijk met nevenstaand plaatje uit te leggen.
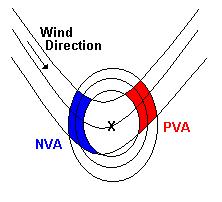 Daarbij stellen de
gesloten cirkels lijnen voor van gelijke absolute vorticiteit (met een
maximum in het midden) en de andere lijnen stellen druklijnen
(geopotentiaallijnen) voor. Een luchtdeeltje beweegt in principe langs de
potentiaallijnen. Gaat een deeltje van hogere naar lagere absolute
voriticiteit, dan neemt het deeltje als het ware hogere vorticiteitswaardes
mee. M.a.w. is sprake van positieve vorticiteitsadvectie (PVA rood).
Andersom is sprake van negatieve vorticiteitsadvectie (NVA blauw)
Daarbij stellen de
gesloten cirkels lijnen voor van gelijke absolute vorticiteit (met een
maximum in het midden) en de andere lijnen stellen druklijnen
(geopotentiaallijnen) voor. Een luchtdeeltje beweegt in principe langs de
potentiaallijnen. Gaat een deeltje van hogere naar lagere absolute
voriticiteit, dan neemt het deeltje als het ware hogere vorticiteitswaardes
mee. M.a.w. is sprake van positieve vorticiteitsadvectie (PVA rood).
Andersom is sprake van negatieve vorticiteitsadvectie (NVA blauw)
Er is een duidelijk verband tussen vorticiteitsadvectie en verticale luchtbeweging. Dit verband dat samengevat is in de zg. omega-vergelijking , laat zien zien dat bij PVA de lucht stijgt en bij NVA de lucht daalt. De vorticiteitsadvectie is niet alleen verantwoordelijk. Ook de temperatuuradvectie is van groot belang (zie ook "T.-Adv. 500" en "T.-Adv. 850"). Een mooie toepassing zijn bovenluchtstoringen, waarbij soms de grondkaarten weinig neerslagactiviteit laten zien, maar een grote PVA kan duiden op verhoogde buienactiviteit.
 Daarbij stellen de
gesloten cirkels lijnen voor van gelijke absolute vorticiteit (met een
maximum in het midden) en de andere lijnen stellen druklijnen
(geopotentiaallijnen) voor. Een luchtdeeltje beweegt in principe langs de
potentiaallijnen. Gaat een deeltje van hogere naar lagere absolute
voriticiteit, dan neemt het deeltje als het ware hogere vorticiteitswaardes
mee. M.a.w. is sprake van positieve vorticiteitsadvectie (PVA rood).
Andersom is sprake van negatieve vorticiteitsadvectie (NVA blauw)
Daarbij stellen de
gesloten cirkels lijnen voor van gelijke absolute vorticiteit (met een
maximum in het midden) en de andere lijnen stellen druklijnen
(geopotentiaallijnen) voor. Een luchtdeeltje beweegt in principe langs de
potentiaallijnen. Gaat een deeltje van hogere naar lagere absolute
voriticiteit, dan neemt het deeltje als het ware hogere vorticiteitswaardes
mee. M.a.w. is sprake van positieve vorticiteitsadvectie (PVA rood).
Andersom is sprake van negatieve vorticiteitsadvectie (NVA blauw)Er is een duidelijk verband tussen vorticiteitsadvectie en verticale luchtbeweging. Dit verband dat samengevat is in de zg. omega-vergelijking , laat zien zien dat bij PVA de lucht stijgt en bij NVA de lucht daalt. De vorticiteitsadvectie is niet alleen verantwoordelijk. Ook de temperatuuradvectie is van groot belang (zie ook "T.-Adv. 500" en "T.-Adv. 850"). Een mooie toepassing zijn bovenluchtstoringen, waarbij soms de grondkaarten weinig neerslagactiviteit laten zien, maar een grote PVA kan duiden op verhoogde buienactiviteit.